Data model: the ER diagram
The ER diagram is a picture of your app's data: every table, the columns in it, and the lines that show how tables refer to each other. Use it to understand how your app stores information before you change forms or tables.
Before you start
- You need access to your app's Customize tab (usually a team admin).
- Your app must have finished building, so that it has tables to show.
- The diagram is for looking only. You add or change tables and columns in the page builder.
Steps
Open the ER diagram
In your app, open the Customize tab. In the narrow icon bar on the far left of the editor, select ER Diagram (hover over the icons to see their names).
The page list and the right-hand panel close, and the diagram fills the screen. A short loading bar may appear while your tables are laid out. The diagram is framed so that all tables fit on screen.
Read a table
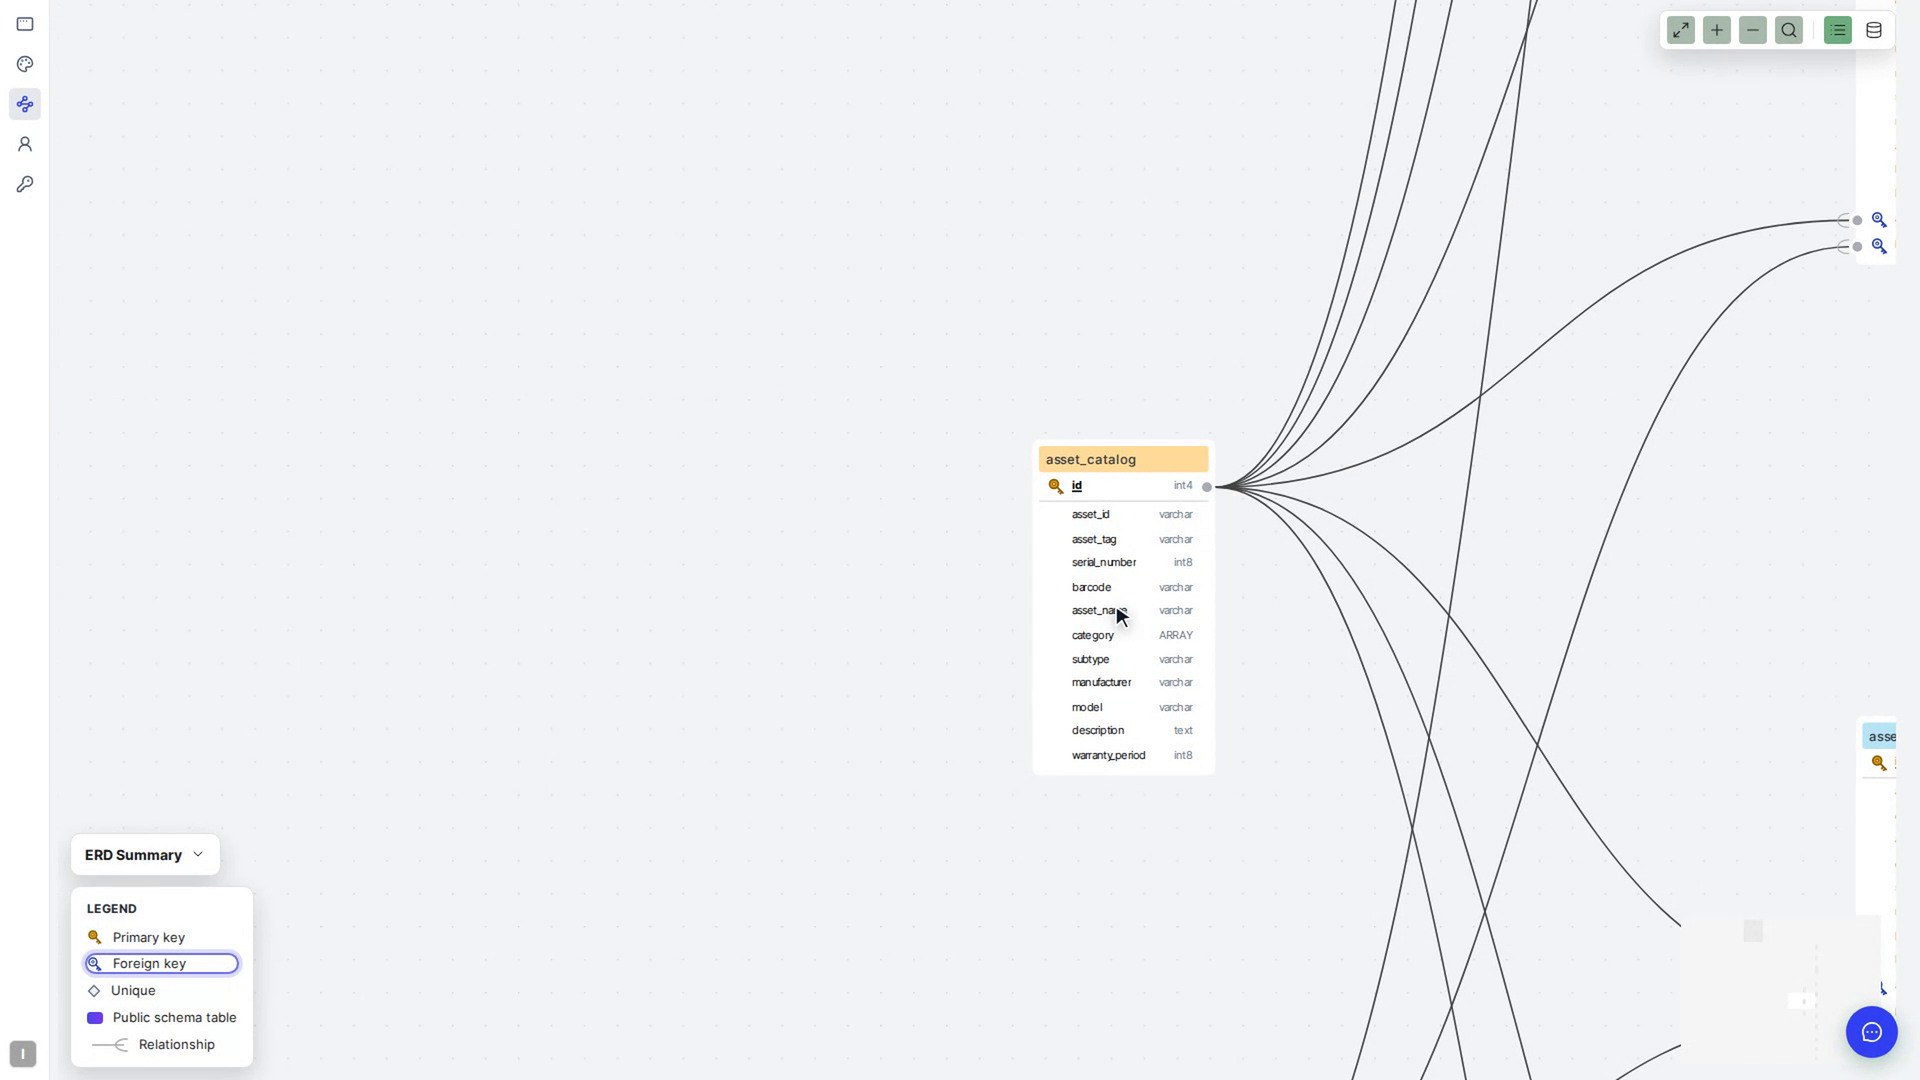
Each box is one table. The coloured header shows the table's name, and each row below it is a column, with the column's name on the left and its data type (for example text, int8 or bool) on the right.
Look at the small icons to the left of a column name:
- A key icon marks the Primary key, the column that identifies each record. Its name is also underlined.
- A different key icon marks a Foreign key, a column that points to a record in another table. Hover over it to see which table and column it refers to (for example "references customer.id").
- A Unique icon, with a light grey row behind it, marks a column where no two records can have the same value.
Column names in bold are required: a record can't be saved without a value in them.
Tables from the shared public schema have a purple header with a small "public" label in front of the name. The legend in the bottom-left corner explains all of these symbols.
Follow the relationships
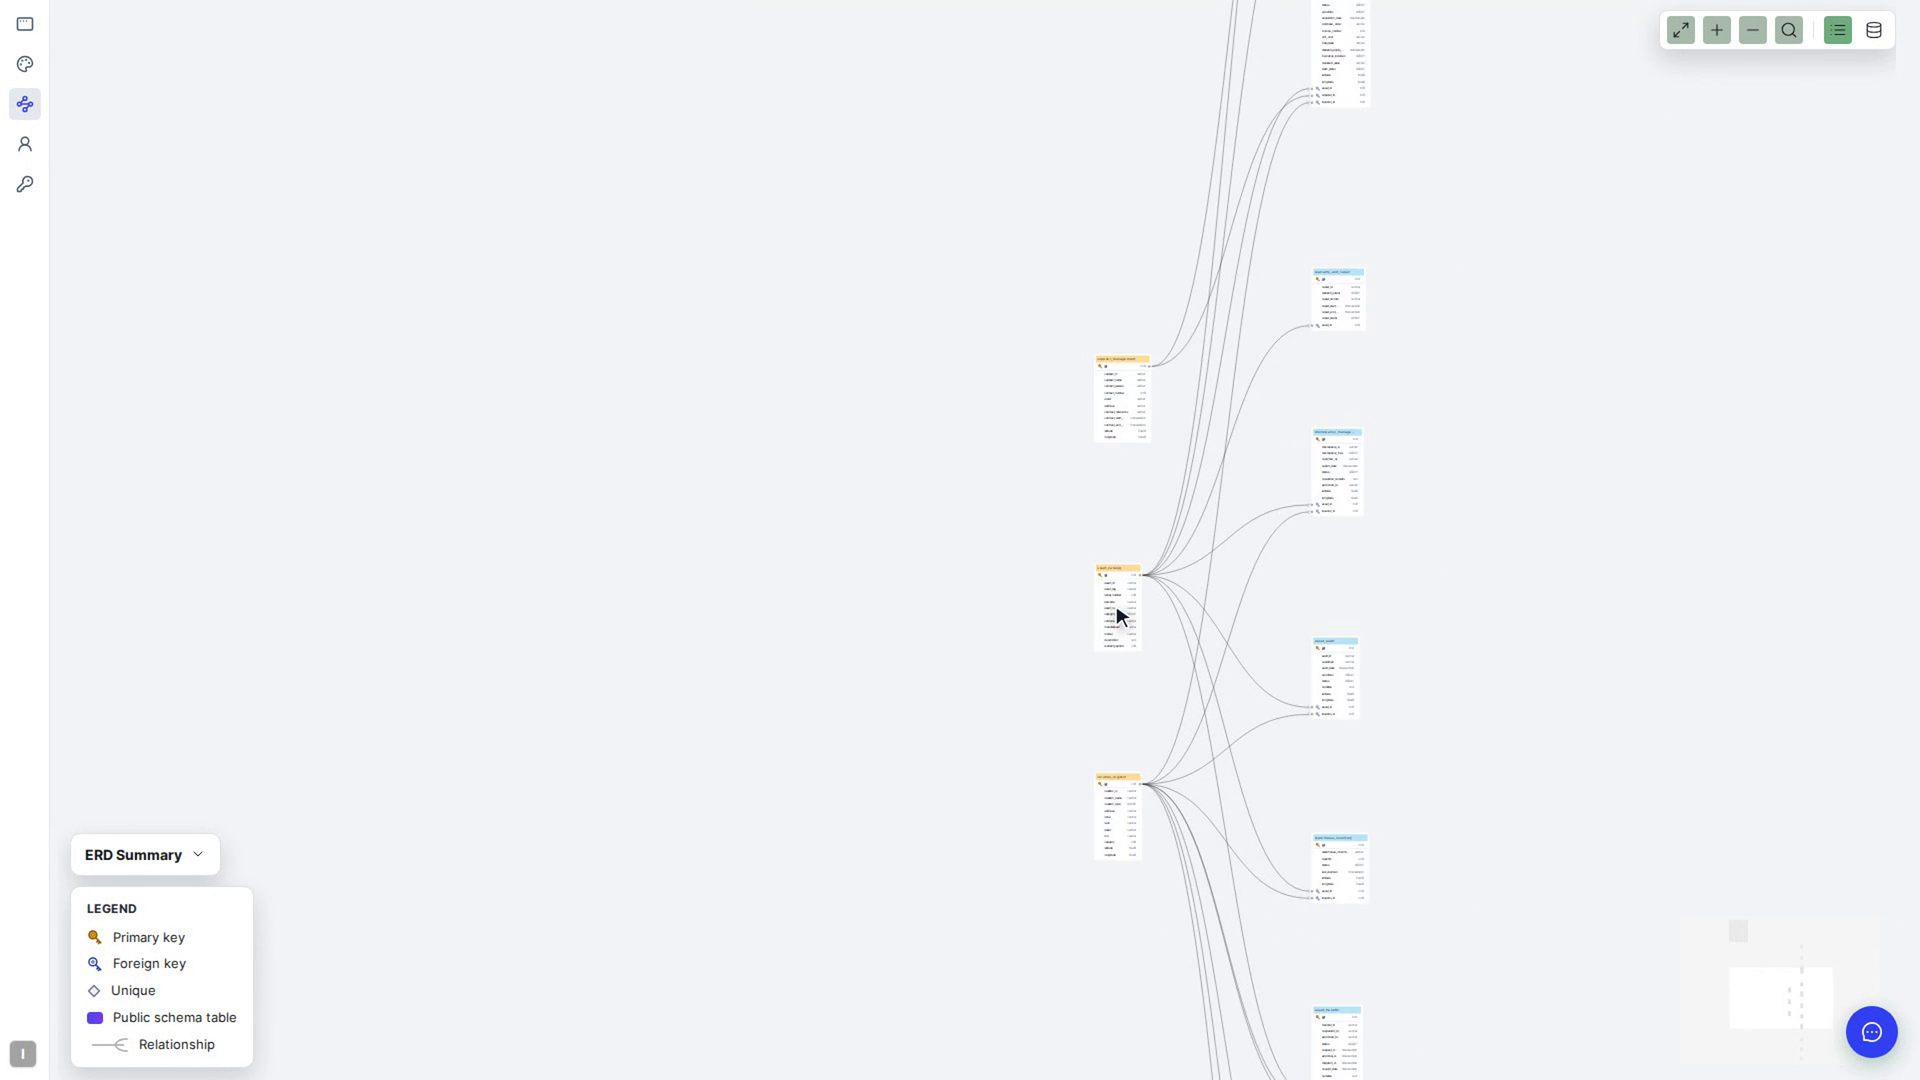
The grey lines between tables are relationships. A line starts at the column being referred to in one table and ends at the foreign key column in the other table. The forked end (like a crow's foot) sits on the table that can hold many records for each record at the other end. For example, one customer can have many orders.
Select a line to highlight it in red, so you can trace it across a busy diagram. Select an empty part of the canvas to clear the highlight.
Tables that aren't connected to any other table are collected together in a dashed box.
Find a table
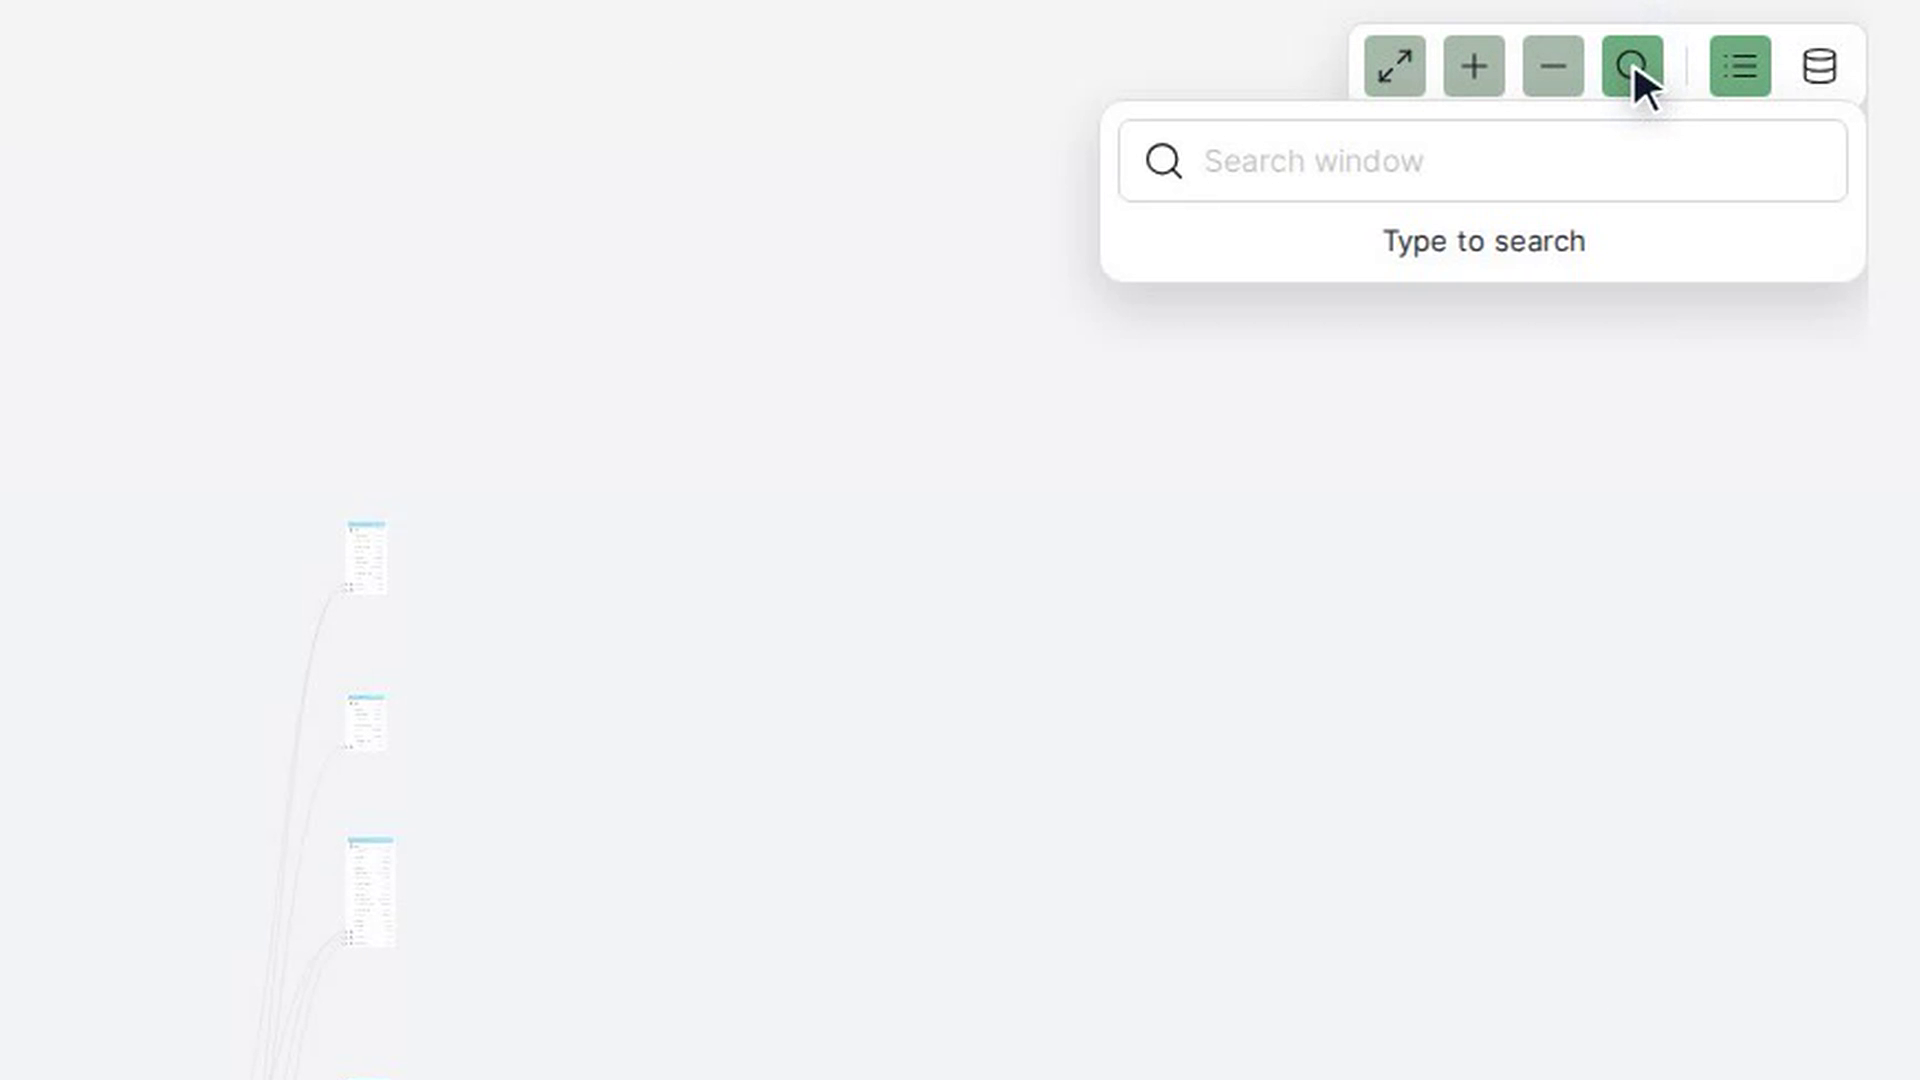
Select the Toggle search panel button (the magnifying glass) in the toolbar at the top right of the diagram. Type part of a table name. Matching tables appear with the number of columns in each.
Select a table in the list. The diagram zooms to that table and outlines it, and the search panel closes. The panel says No tables found if nothing matches.
Zoom and move around
Use the toolbar at the top right:
- Zoom In (plus) and Zoom Out (minus) change the zoom level. You can also scroll with your mouse or trackpad.
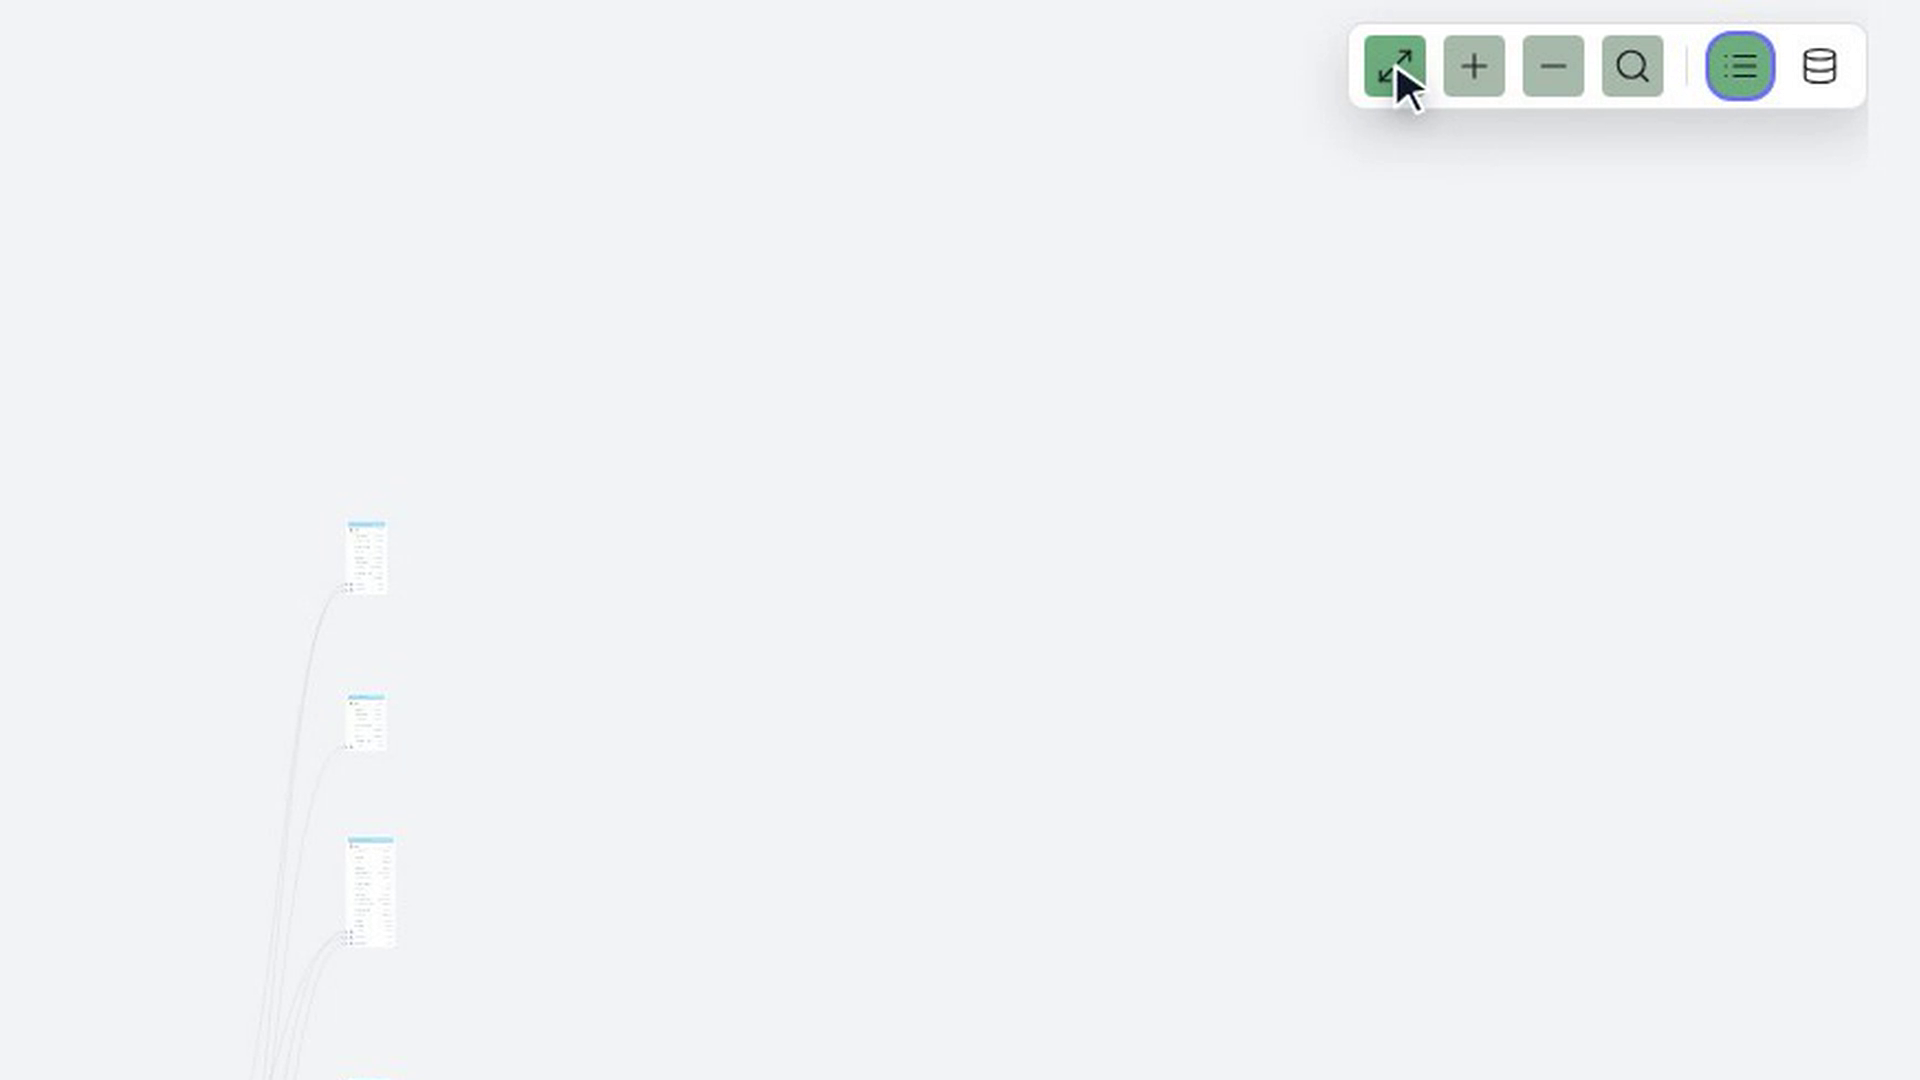
- Fit View brings the whole diagram back into view. On very large diagrams it goes back to a zoomed-out overview instead.
Drag an empty part of the canvas to move around. The small map in the corner shows which part of the diagram you're looking at. You can also drag a table to move it out of the way. This only changes the picture, not your data, and the layout resets the next time you open the diagram.
Choose how many columns to show
The diagram opens in Compact view, which shows the essential columns only. Behind-the-scenes columns such as creation dates, "created by" and "updated by" are hidden.
Select Detailed view — all columns (the database icon) in the toolbar to see every column. Select Compact view — essential columns only (the list icon) to go back. The selected view is highlighted.
See the summary
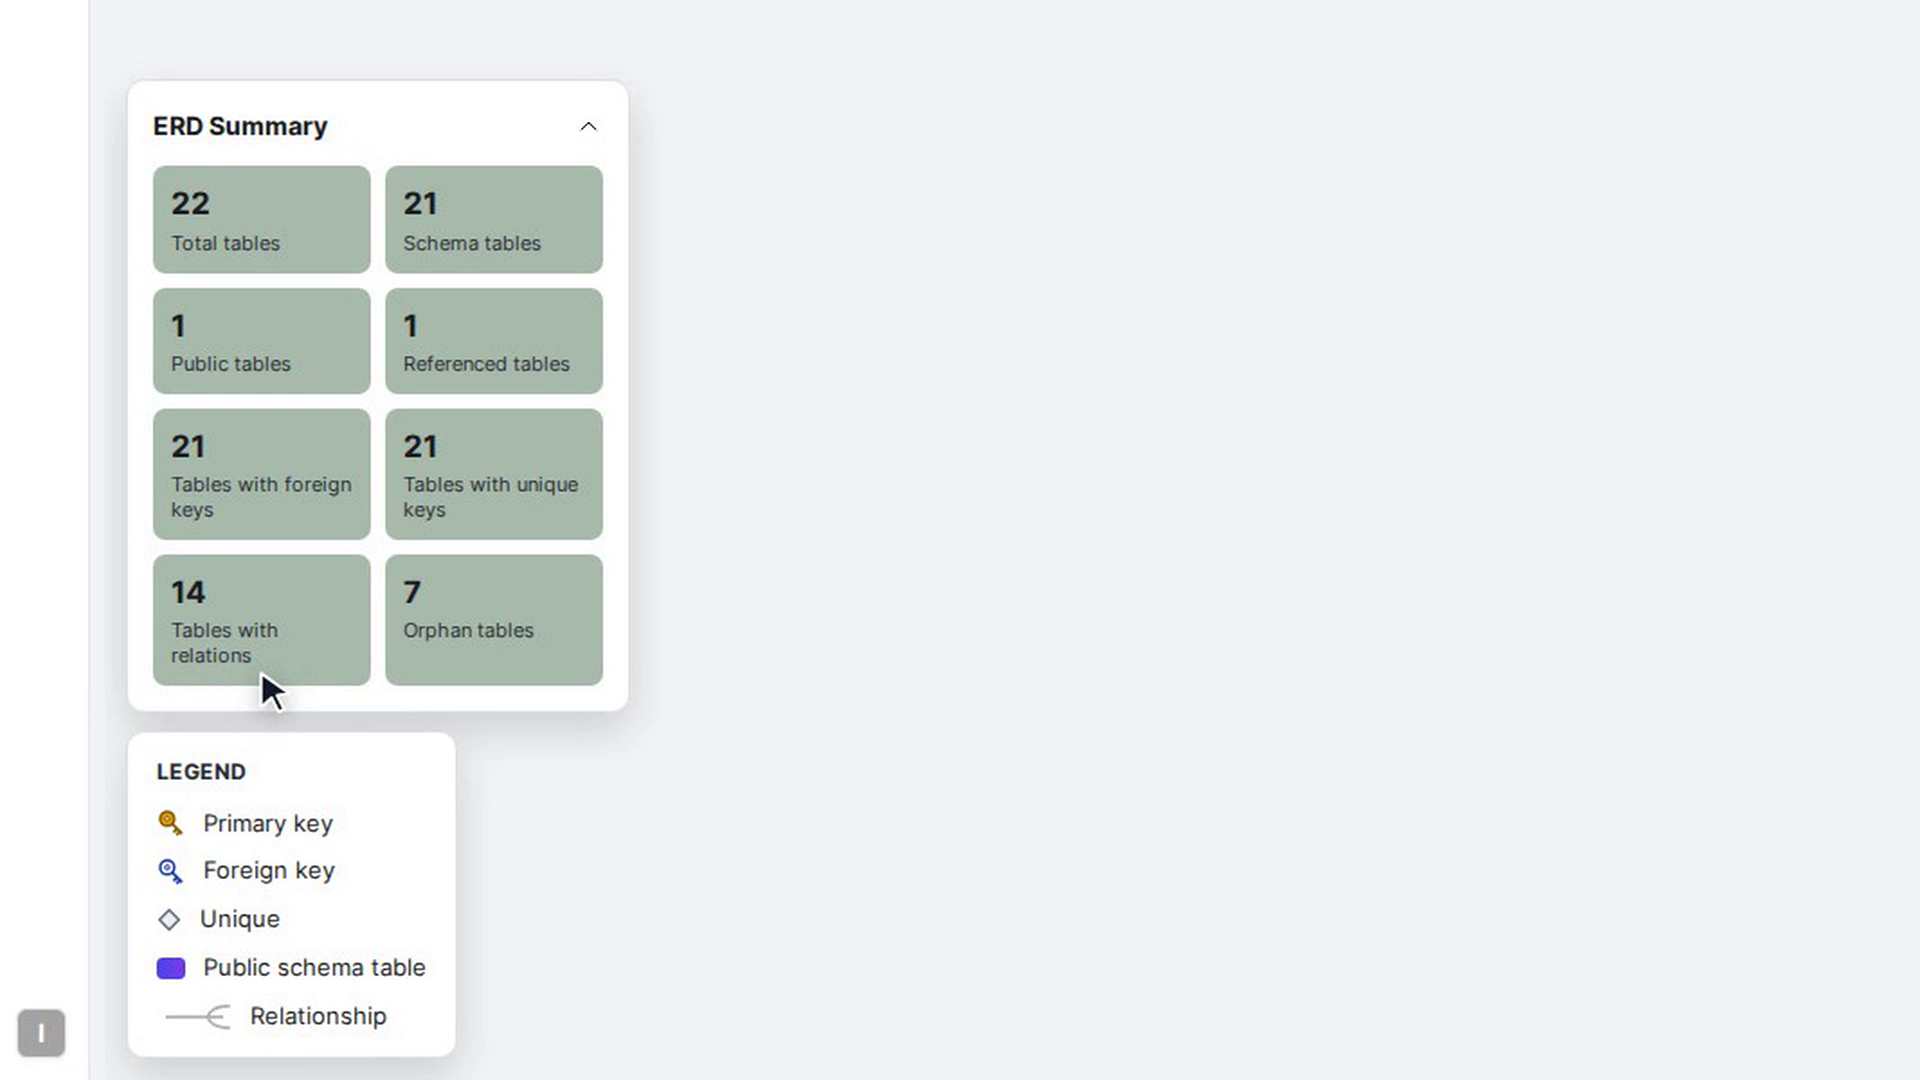
Select ERD Summary in the bottom-left corner to open a set of totals, such as Total tables, Tables with foreign keys, Tables with relations and Orphan tables (tables with no relationships). Select it again to close it.
Screenshots
Step 1: Open the ER diagram

Step 2: Read a table
Step 3: Follow the relationships
Step 4: Find a table
Step 5: Zoom and move around
Step 6: Choose how many columns to show
Step 7: See the summary
Watch how
Tip: The diagram updates from your app's current data model each time you open it. If you've just changed a form or table, open ER Diagram again to see the change.
Tip: To leave the diagram, select Application in the left icon bar. You return to the page you were editing.