AEU used by one app
See how many AEU building one app used compared with the estimate, how long the generation took, and which stages used the most.
Before you start
- Anyone who can open the app can see this.
- The app must have run a generation. Before that you see "No AEU consumption yet".
Steps
Open the app's AEU Consumption
Choose one of these:
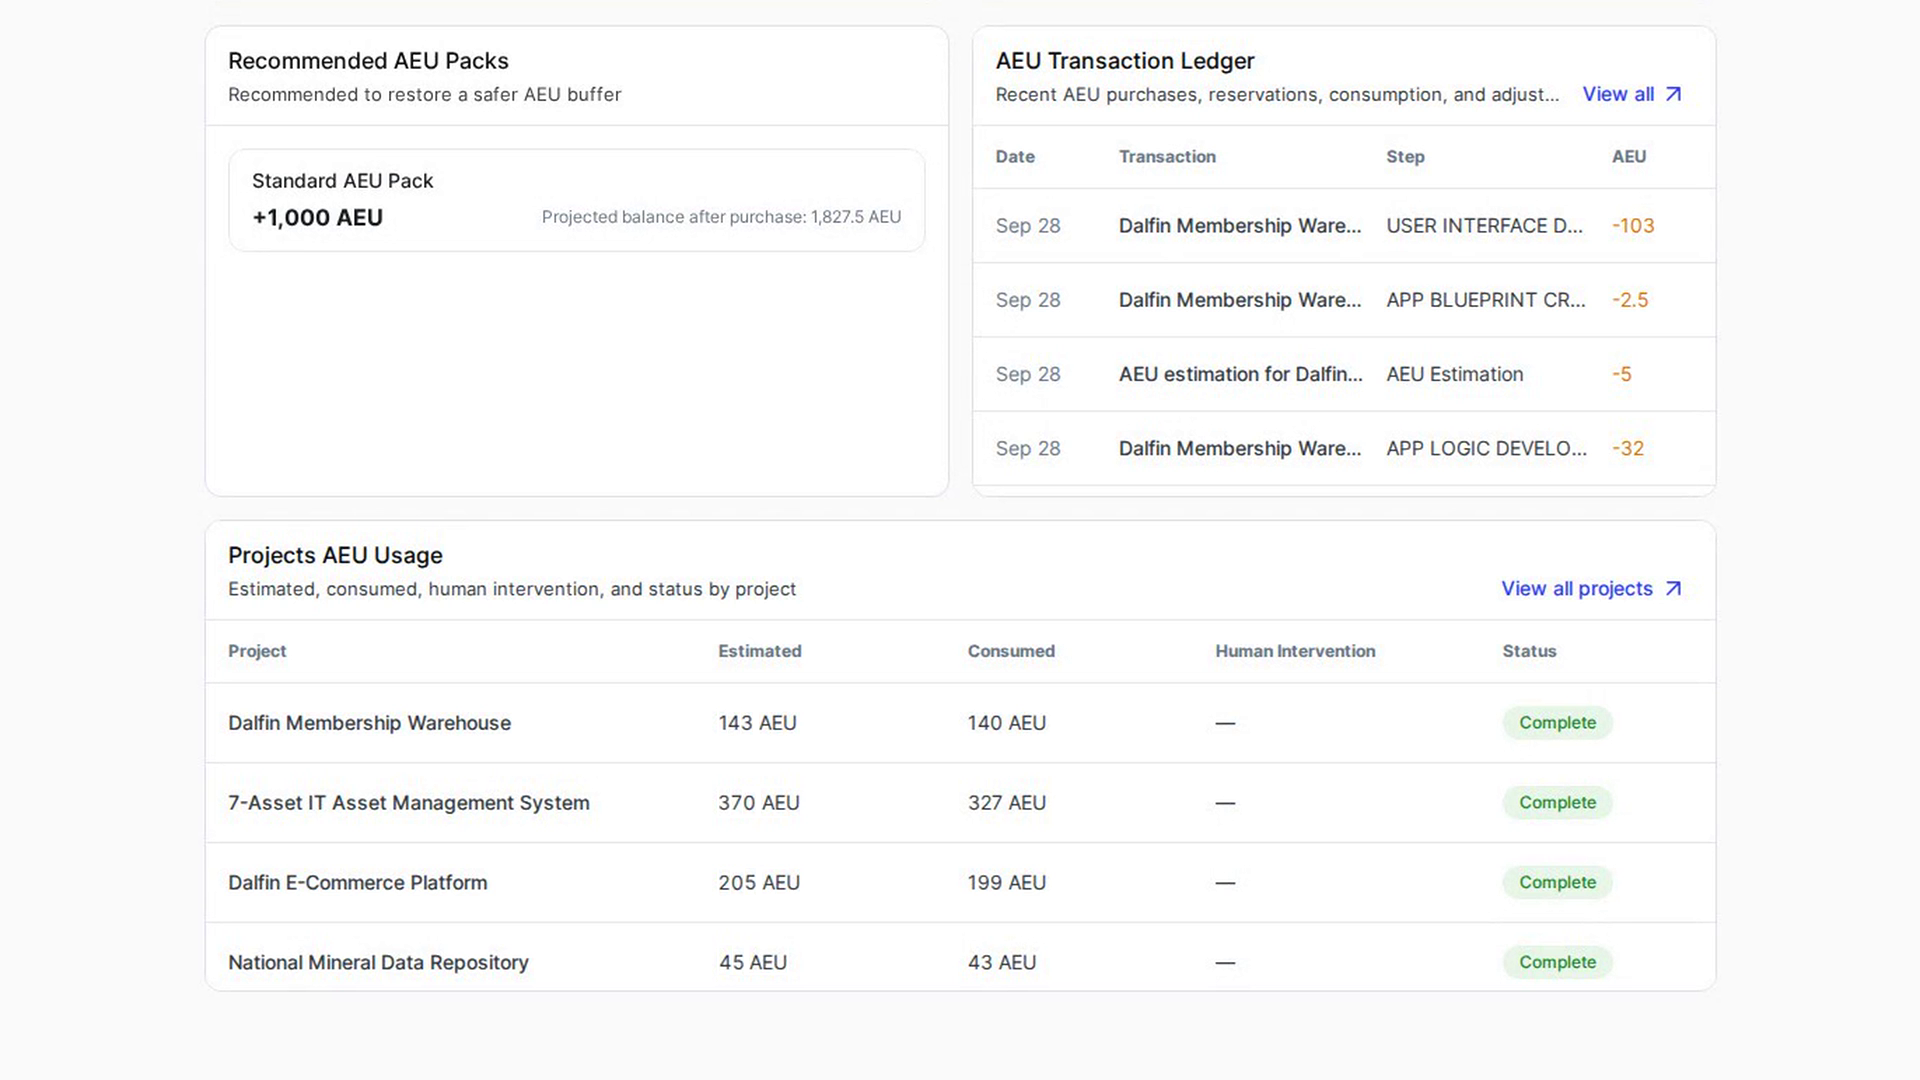
- On your Dalfin home, under Projects AEU Usage, select the project's row.
- Inside the app, select More at the top, then AEU Consumption in the side menu.
The AEU Consumption panel opens.
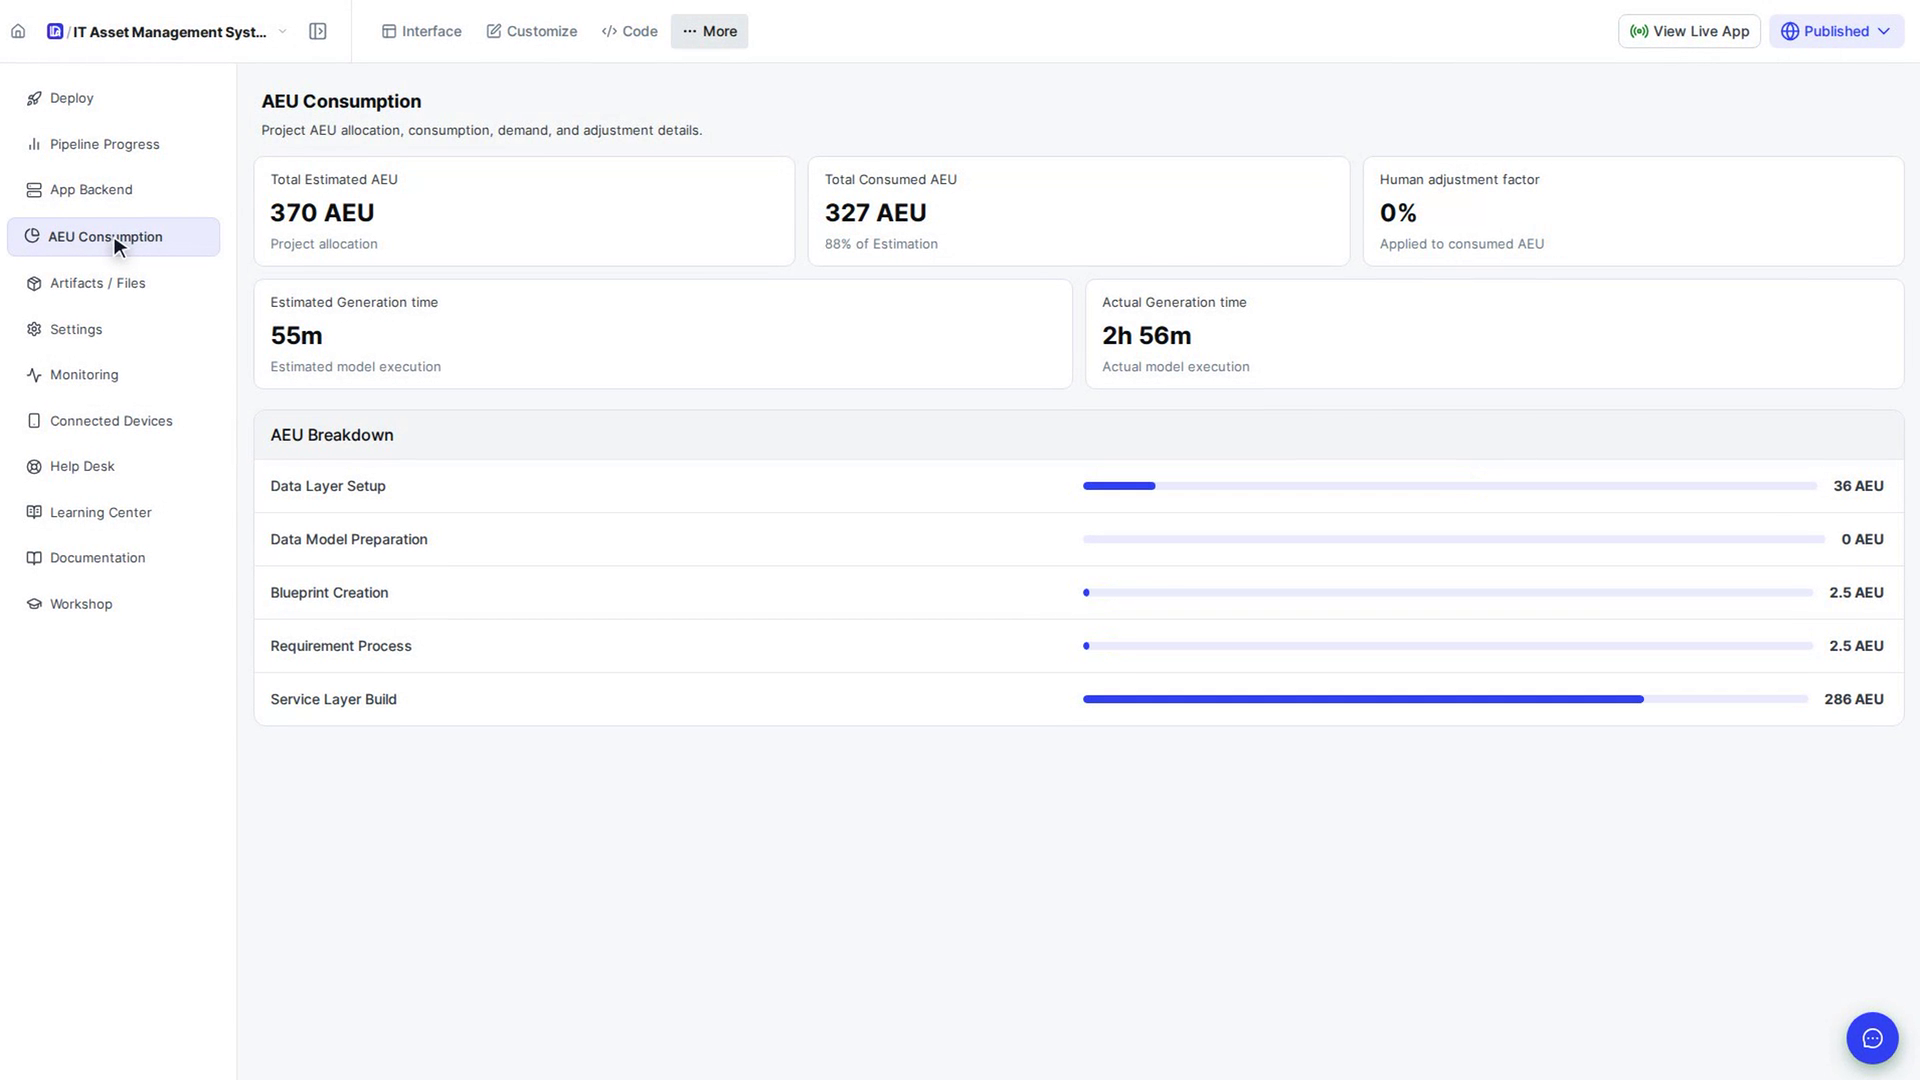
Compare estimated and used AEU
The top cards show Total Estimated AEU (the project allocation), Total Consumed AEU (with how it compares to the estimate) and the Human adjustment factor applied to the consumed AEU.
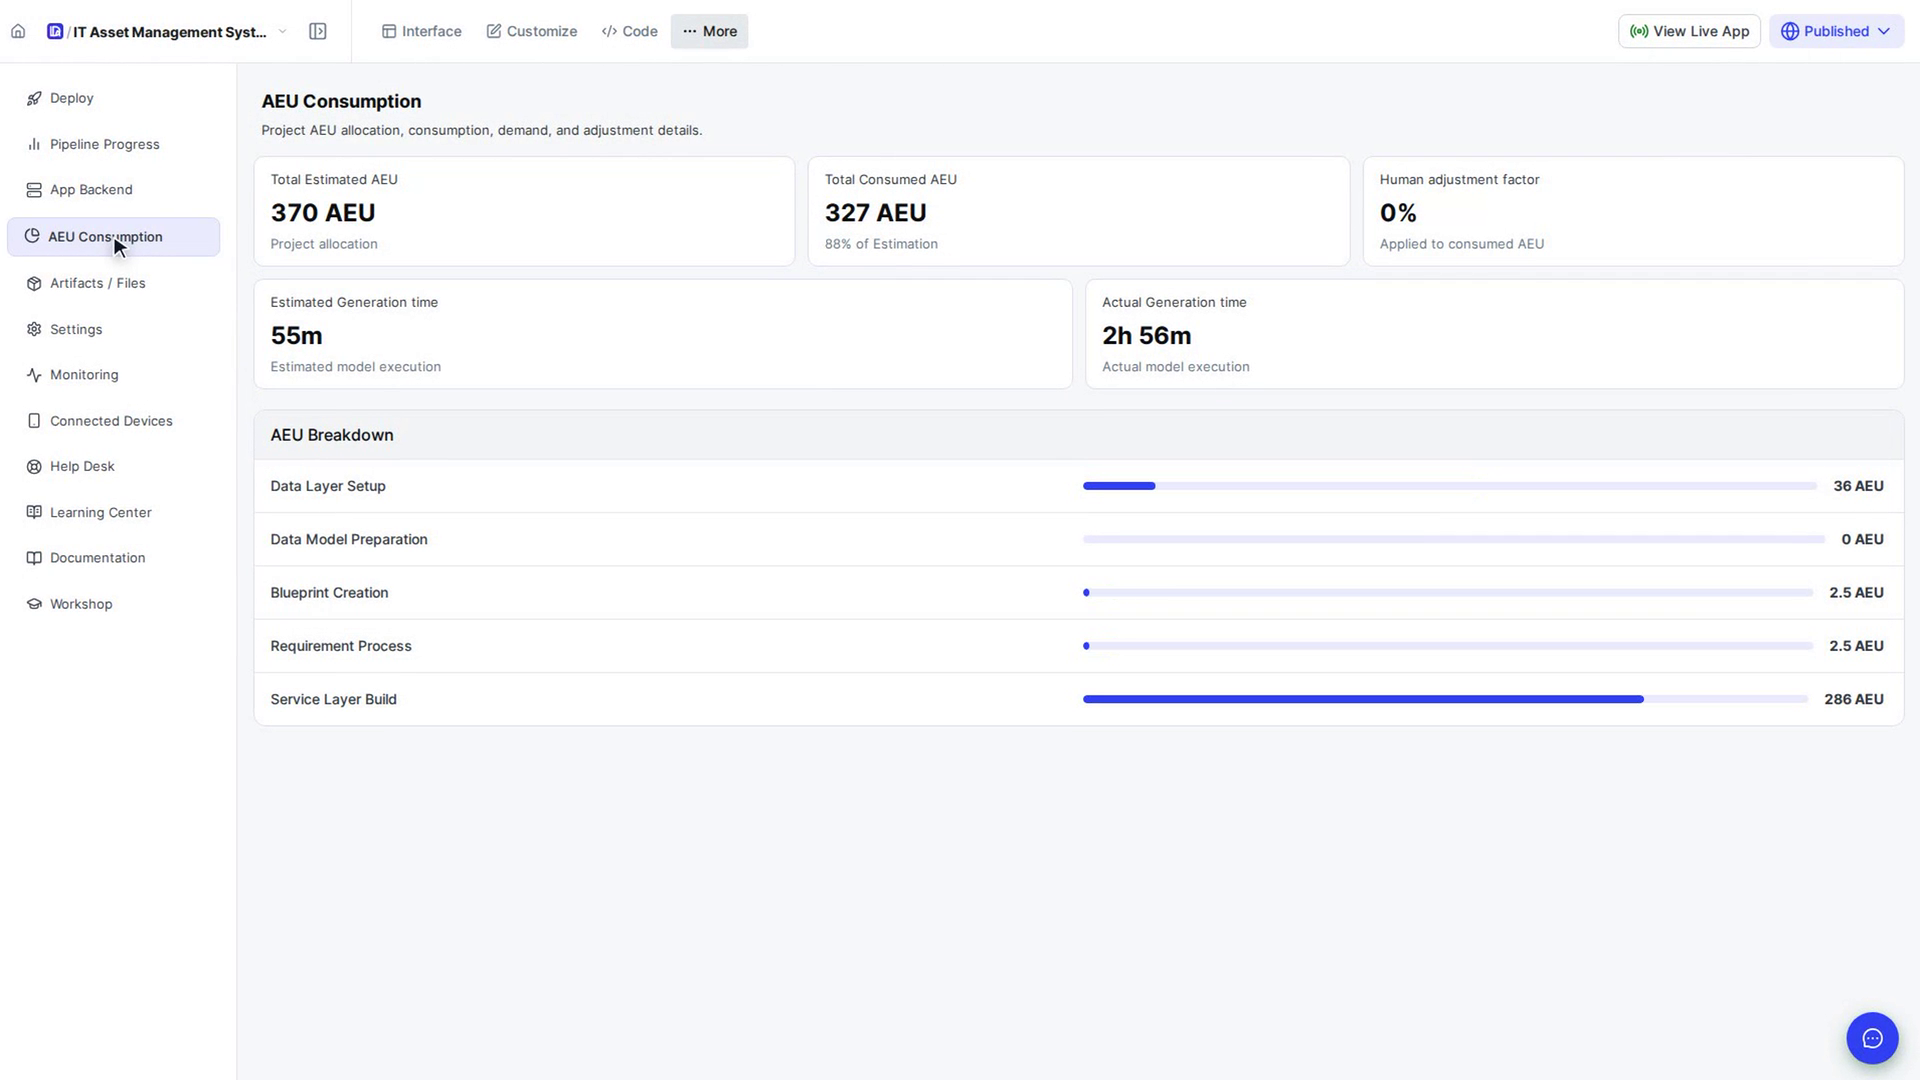
Check the generation time
The next cards show the Estimated Generation time and the Actual Generation time.
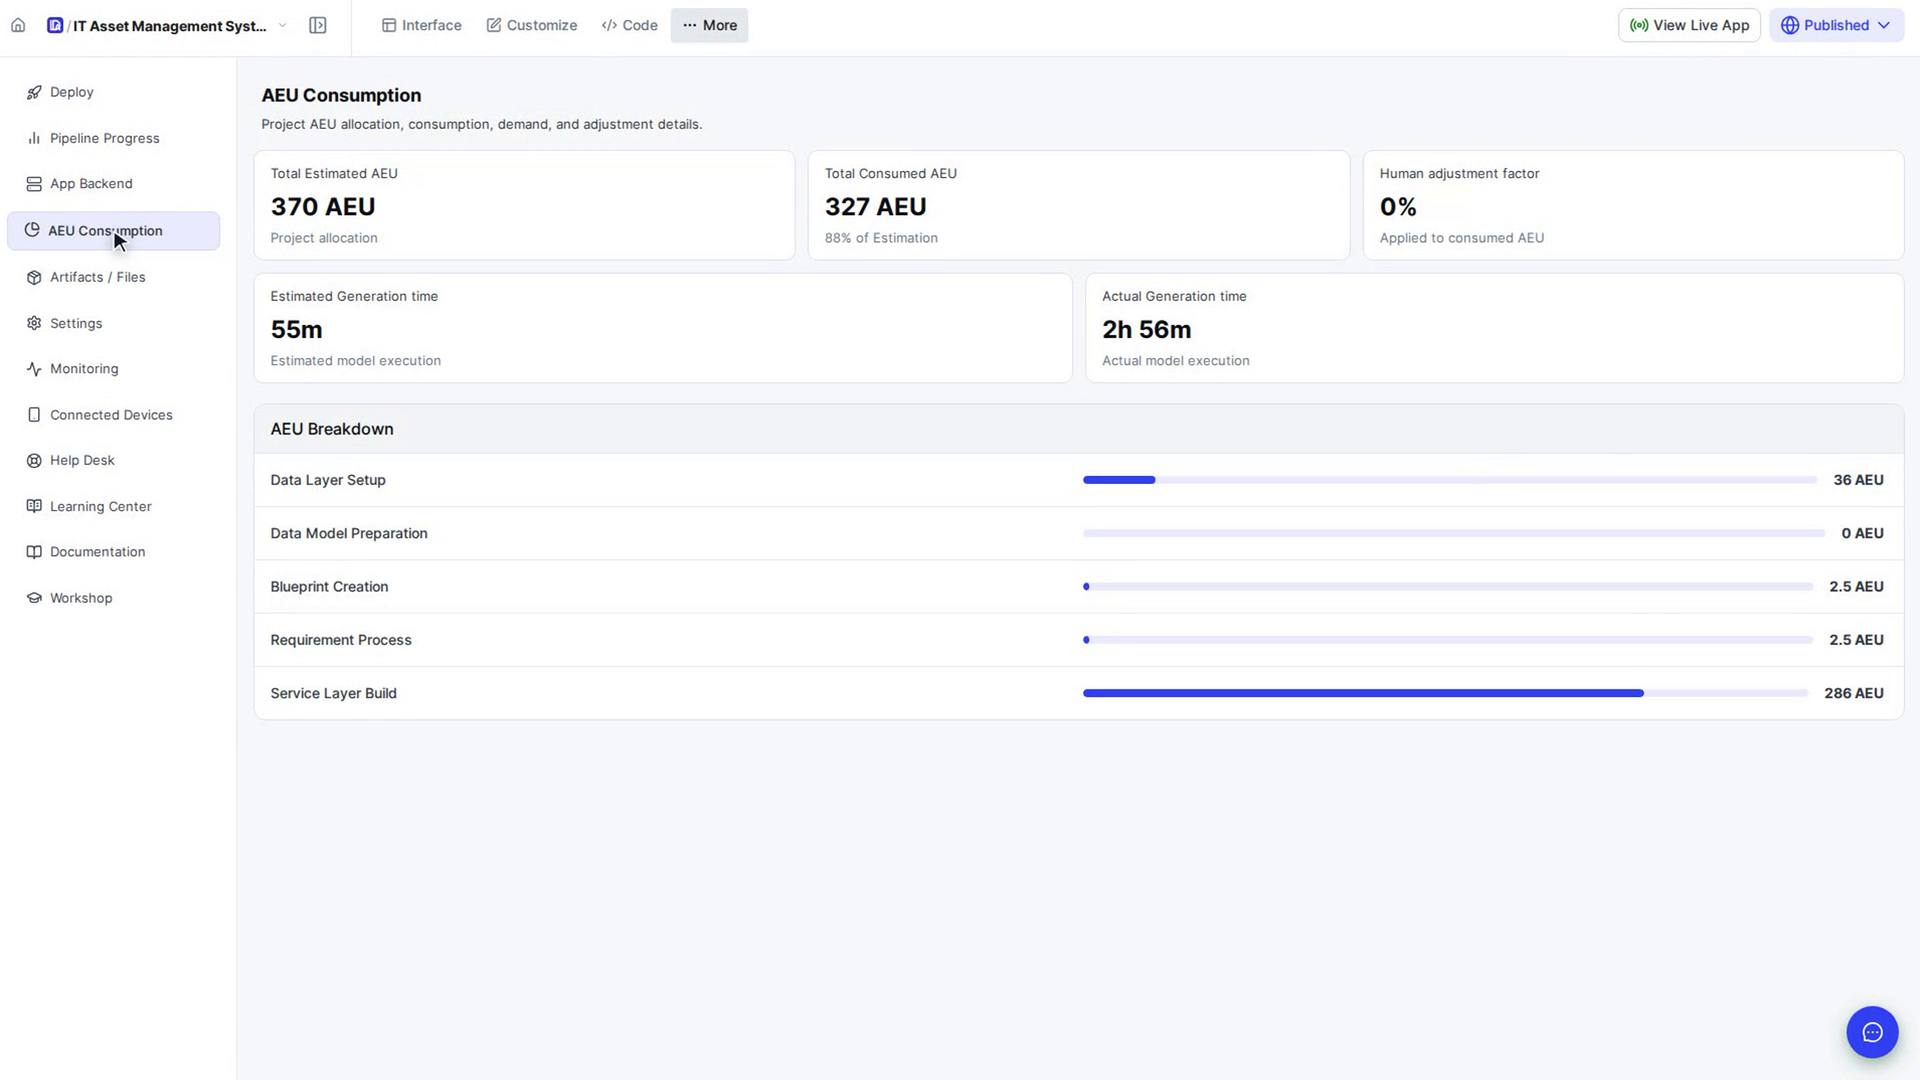
See where the AEU went
AEU Breakdown lists each stage of the build with the AEU it used. The bar shows each stage's share of the estimated total. A stage that used more than the whole estimate shows a full bar, capped at 100%.
Screenshots
Step 1: Open the app's AEU Consumption
Step 2: Compare estimated and used AEU
Step 3: Check the generation time
Step 4: See where the AEU went
Watch how
Tip: Platform admins who open this from the admin panel see extra detail: a full AEU Breakdown table (tokens, time, cost and model per stage), Model & Engineering Contribution, and Human Adjustment & Client Report (System actual, Human adjustment, Final charged AEU).