Monitoring
The Monitoring view shows a live monitoring dashboard right inside your app's workspace. The dashboard is for the workspace your app runs in, so it can include figures for the services around your app as well as the app itself. Use it to keep an eye on how your running app is doing.
Before you start
- This page is for team admins. There is no extra role check on the view.
- The app's deployment must have got past its first step, Preparing for Deployment. Until then the view says the initial setup is not completed.
Steps
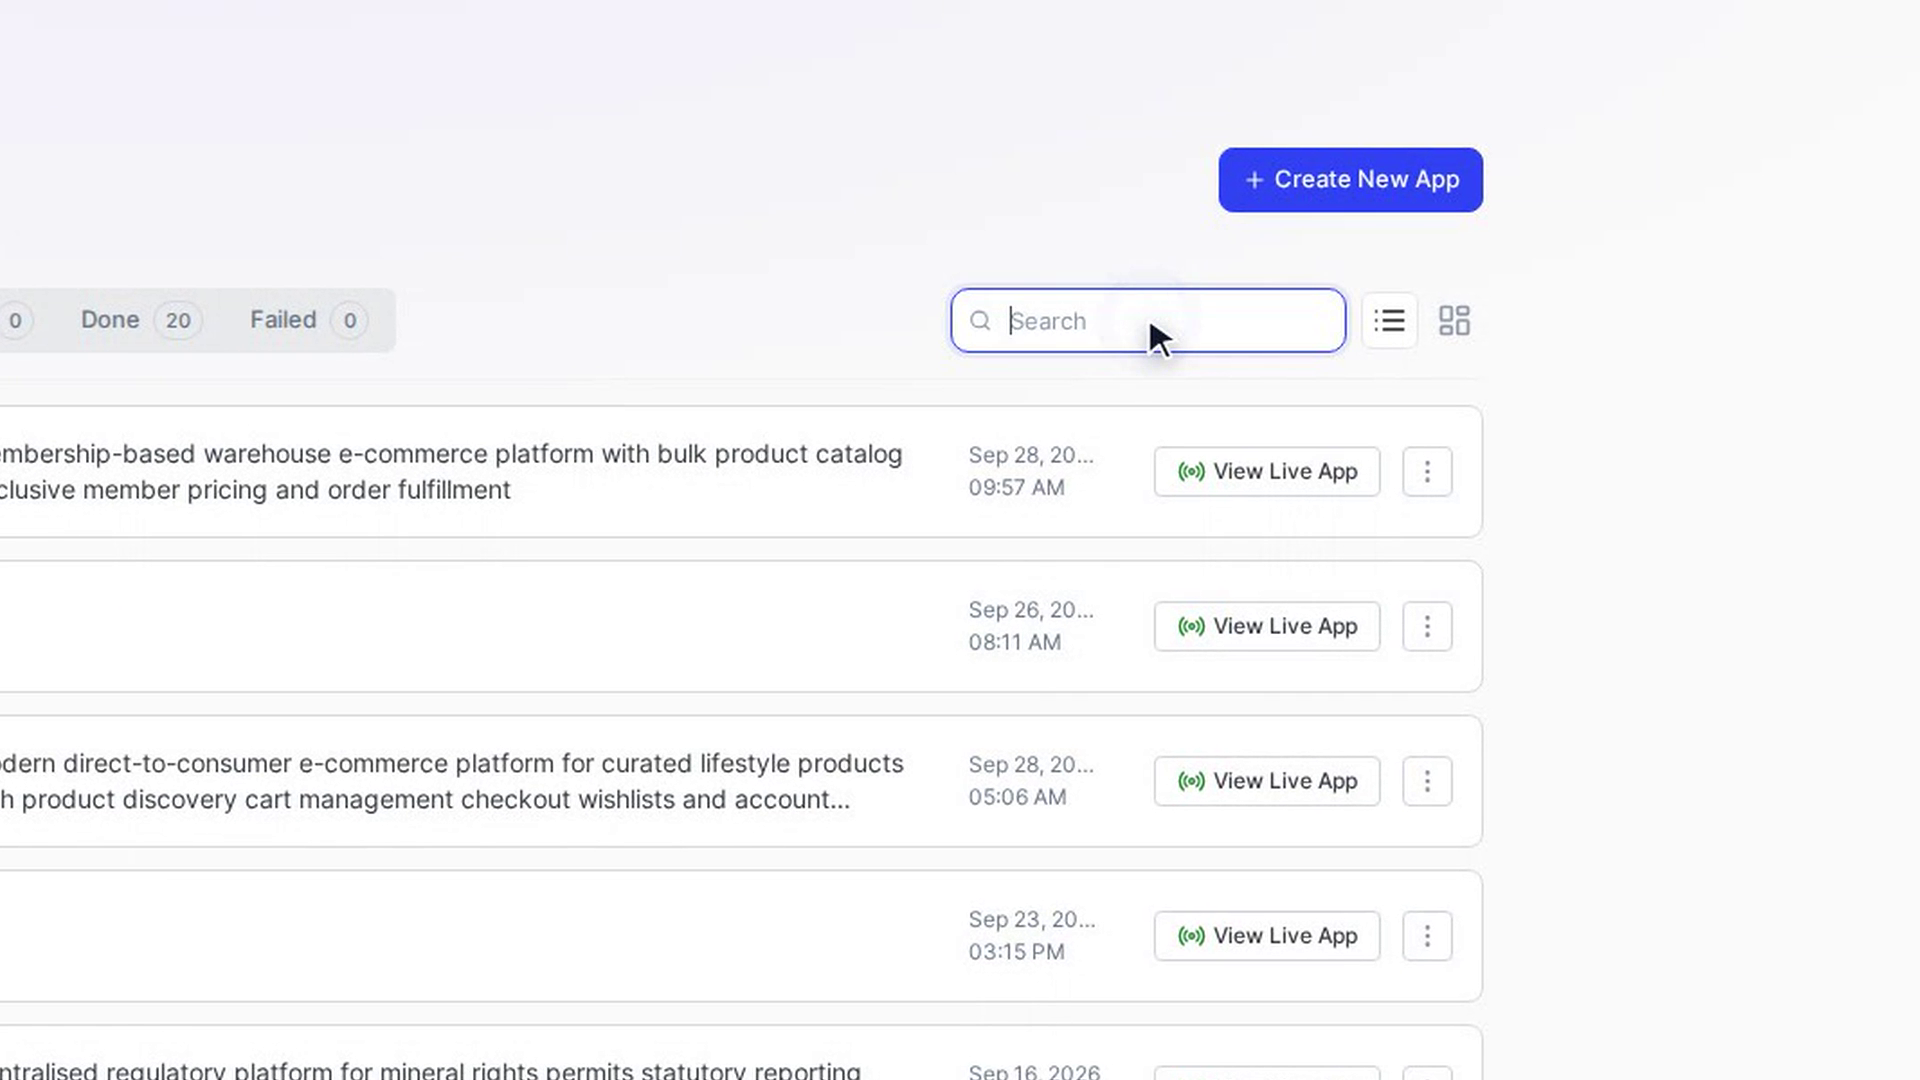
Open your app
Open the app from All Apps. The app workspace opens with its tabs along the top.
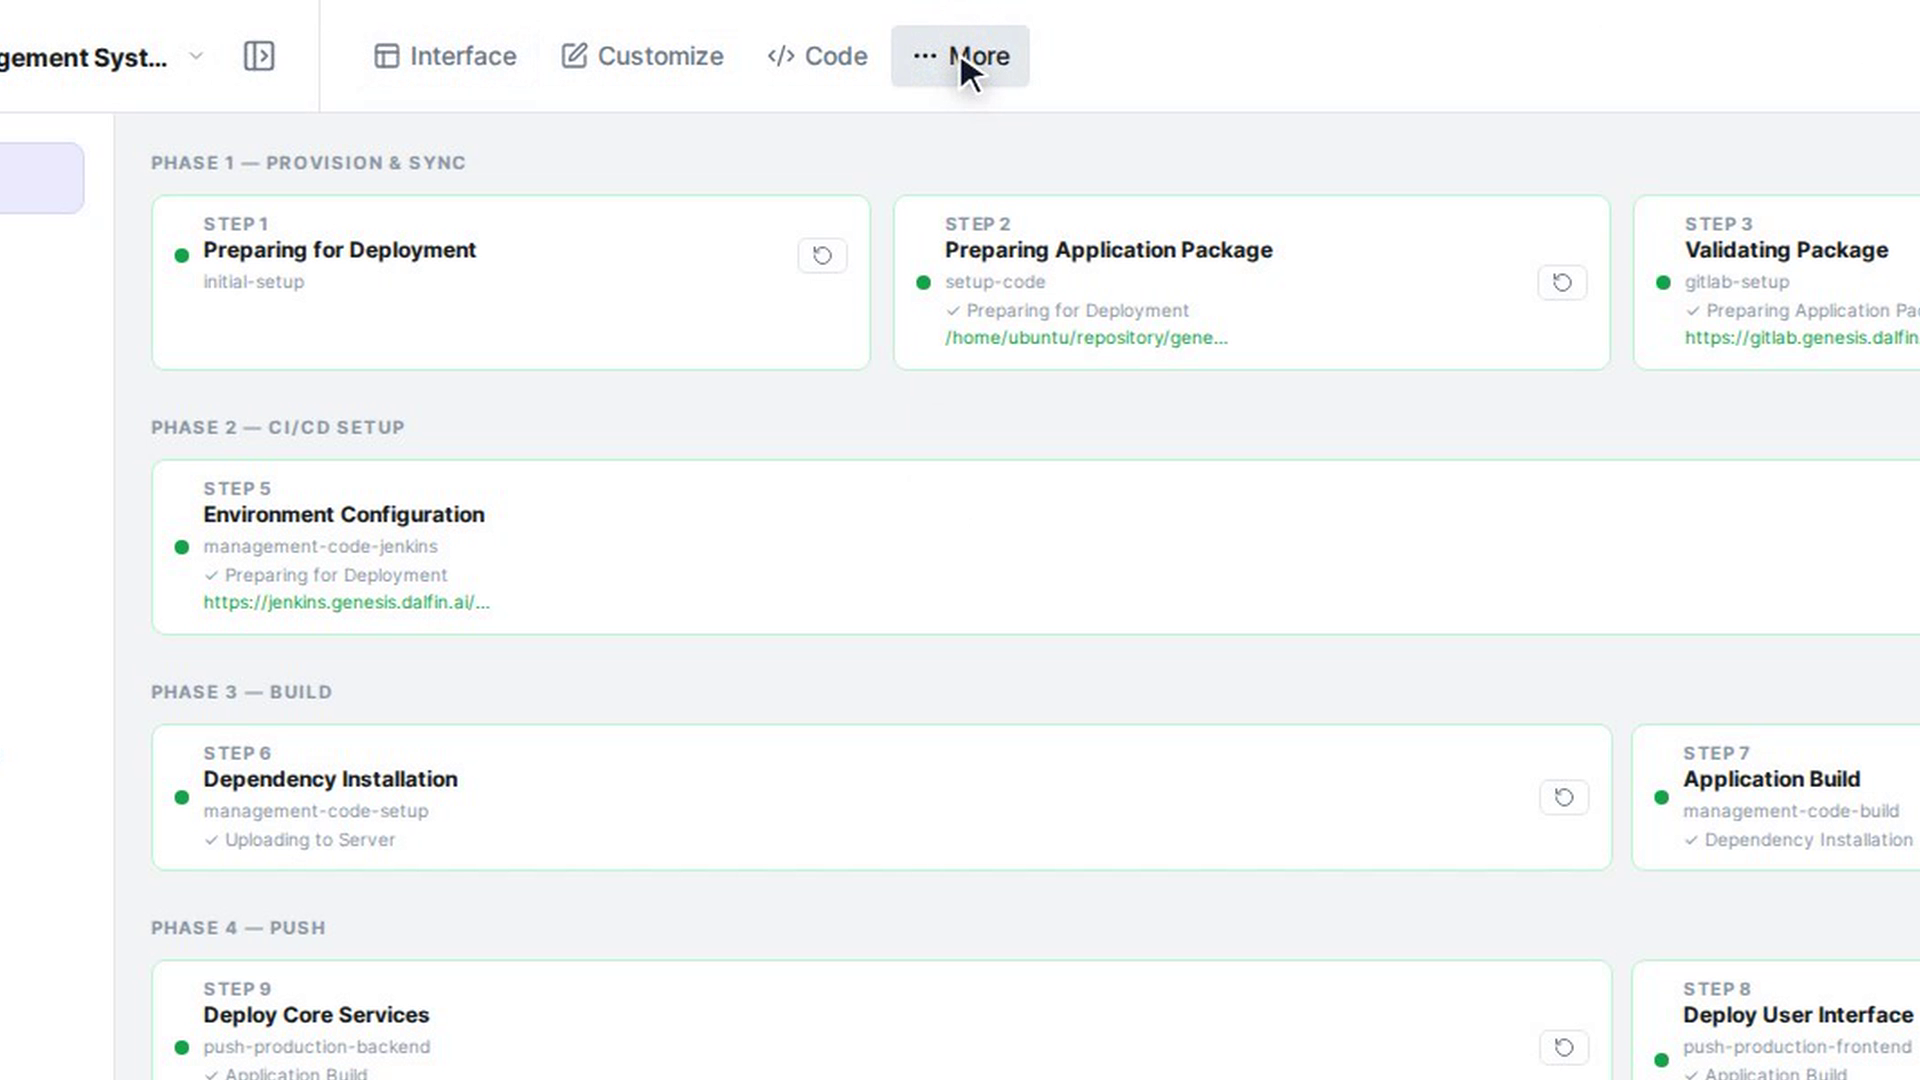
Go to More
Select More in the top bar. The Deploy view opens, with a list of the other views down the left side.
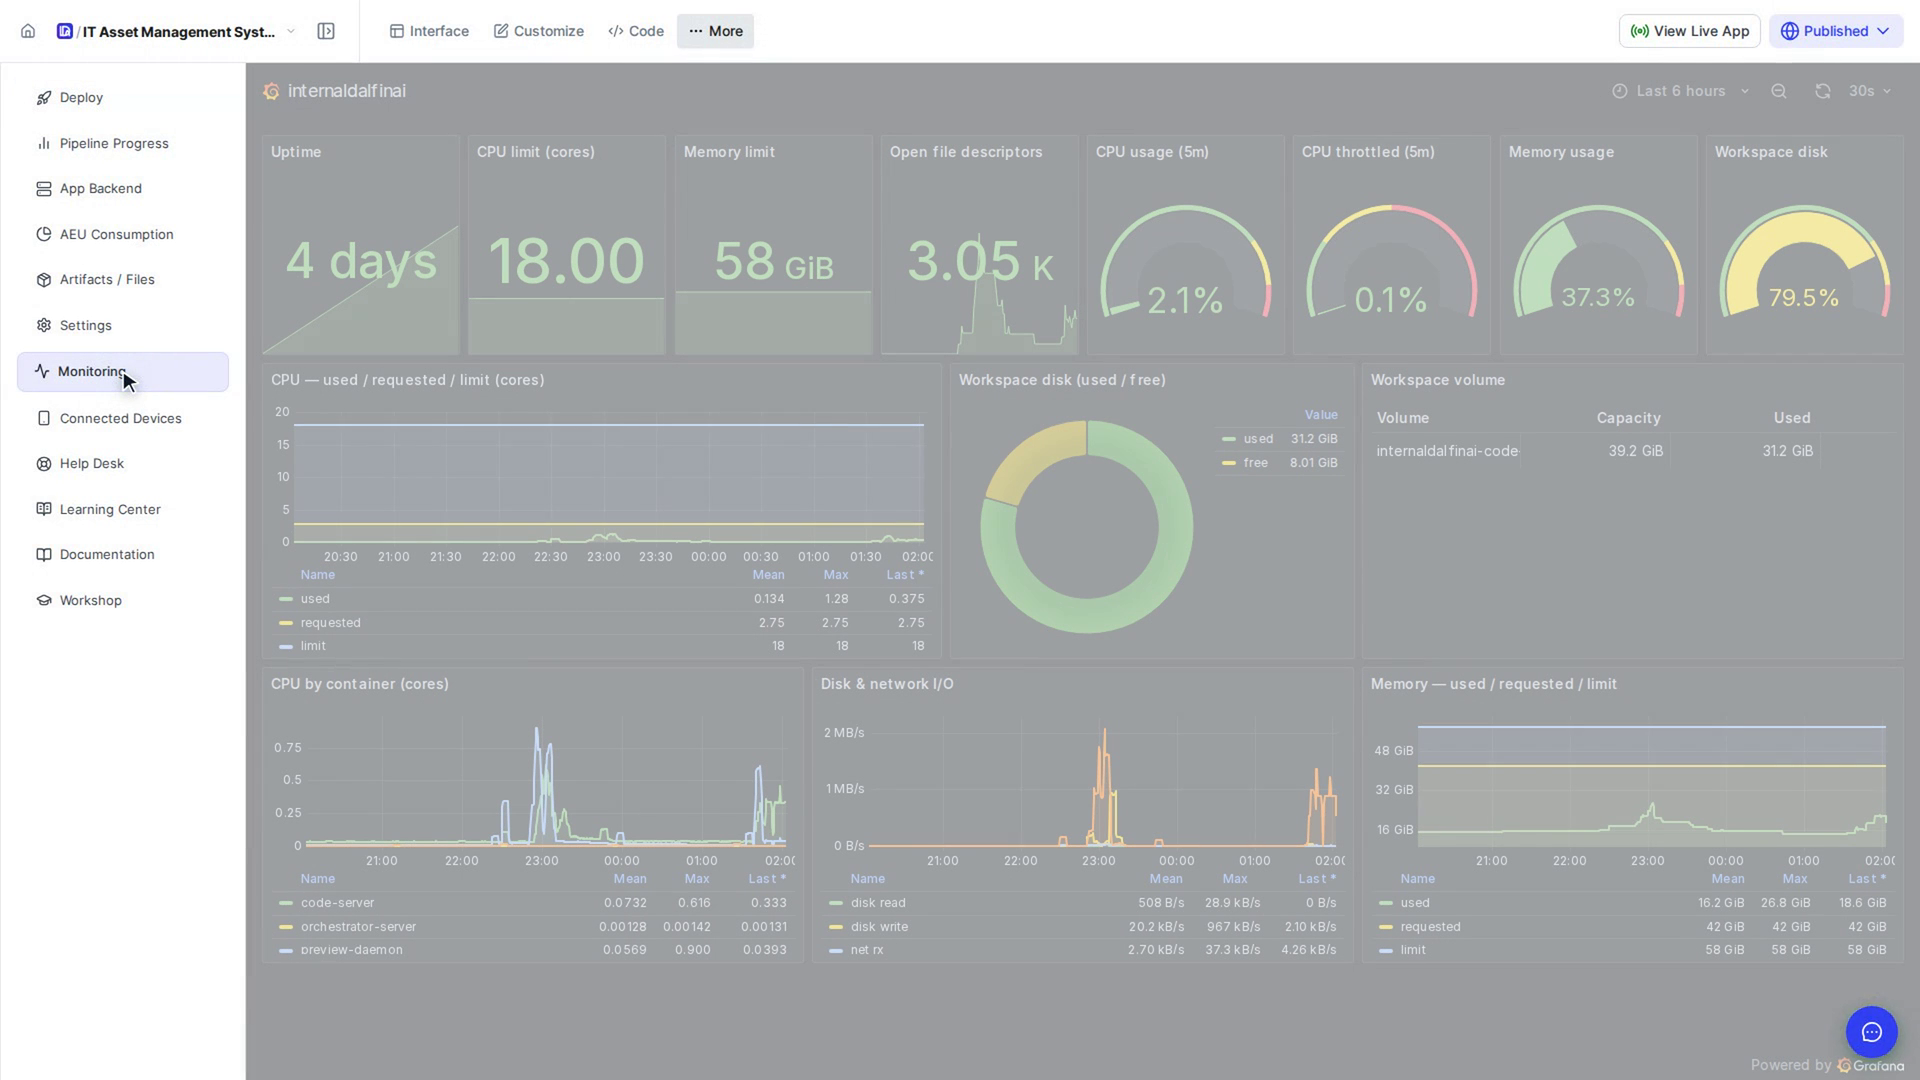
Select Monitoring
Select Monitoring in that list. A Grafana monitoring dashboard loads in the panel. It's titled with your workspace's name, and its charts cover that workspace, for example CPU use for each container running in it.
If the initial setup has not finished yet, you see a message that monitoring will be available once it finishes. If you see Monitoring not available yet, the workspace your app is deployed to has not been identified yet; try again once the deployment has moved on.
Screenshots
Step 1: Open your app
Step 2: Go to More
Step 3: Select Monitoring
Watch how
Tip: Operations staff can also open workspace dashboards from outside an app in Tenant monitoring.